From the stack sensor to the signed report
Hardware, validated processing and reporting sit in one environment, so operators, environmental teams and regulators work from the same numbers.
What monitoring teams actually open
Each module writes into the same facility model, so a device change, a threshold update or a new stack is reflected everywhere.
Live monitoring
Current readings from every connected analyzer.
Facilities
Sites, stacks and monitoring points in one model.
Devices
Analyzer health, calibration due dates and uptime.
Emissions
Validated concentrations and derived mass rates.
Analytics
Trends, comparisons and exceedance windows.
Alerts
Limit, availability and instrument notifications.
Reports
Scheduled performance packs, signed when you need them.
GOCEMS AI
On-demand reports that explain a period: emissions, device health and anomalies.
Compliance
Thresholds, averaging rules and the audit trail.
A checked path for every reading
Layers stay separate on purpose. Nothing reaches a report without passing validation.
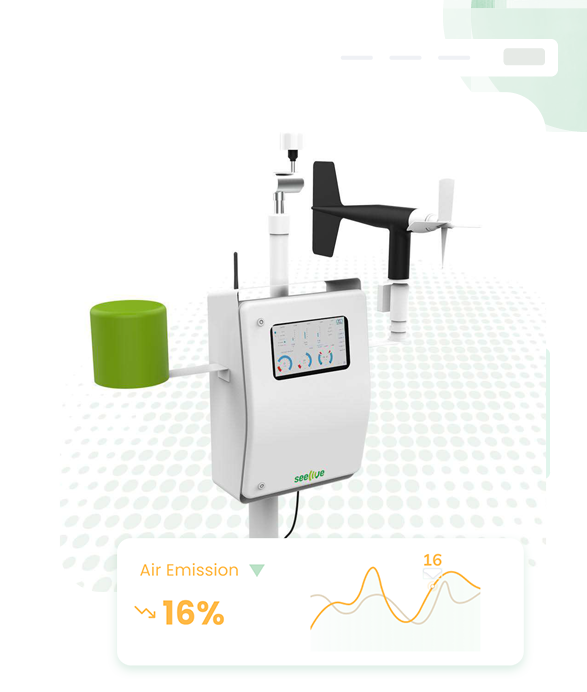
CEMS Devices
Analyzers, probes and flow sensors at the stack.
Edge / Device Connectivity
Local data loggers buffer and forward readings.
Secure Data Transmission
Encrypted transport with delivery confirmation.
GOCEMS Platform
Ingestion, identity and facility model.
Data Processing
Validation, averaging and normalisation.
Analytics
Trends, comparisons and exceedance detection.
Dashboard
Live operational view for teams and regulators.
Reports & Alerts
Scheduled packs, live notifications and GOCEMS AI period reports.
GOCEMS AI explains the data it already collects
Live readings, maps and alerts are the operational core. AI sits beside them. When a team needs to understand a period, not just watch it, GOCEMS writes the report.
Choose a device, a date range and the pollutants that matter. The pack that comes back is a short summary, charts or health scores, insights ranked by severity, and recommended actions: a narrative EHS, operations and leadership can read in one sitting.
Emissions analysis
Whether pollutants such as PM2.5, NO₂, SO₂ and CO₂ stayed within configured limits, and how they moved over time.
Device performance
Scores a sensor’s health (uptime, data quality, calibration) so technicians know what to trust and what to service.
Sensor anomaly
Looks for spikes, drift and false alarms, then ranks what to investigate first.
Analyzer health is part of the data
Uptime, calibration status and communication health sit beside measurements, because a reading is only as good as the instrument behind it.
| Device | Model | Station | Uptime | Last calibration |
|---|---|---|---|---|
| CEMS-001 | GX-Analyzer 400 | Accra Industrial Zone | 99.4% | 12 Aug 2026 |
| CEMS-002 | GX-Analyzer 400 | Tema Industrial Facility | 96.1% | 04 Aug 2026 |
| CEMS-003 | Opacity Probe 120 | Tema Cement Works | 99.8% | 18 Aug 2026 |
| CEMS-004 | Flow Sensor FS-9 | Aboadze Power Station | 98.9% | 22 Jul 2026 |
| CEMS-005 | GX-Analyzer 200 | Buipe Terminal | 82.4% | 29 Jun 2026 |
Illustrative demonstration data
Language the plant and the auditor already use
- EN 14181
- QAL2 / AST
- Modbus
- OPC-UA
- Signed PDF reports
- Buffered edge ingest
Questions operators ask
Plain answers on how GOCEMS works for plants, environmental teams and the EPA.
What modules are in the GOCEMS platform?
Live monitoring, facilities, devices, emissions, analytics, alerts, reports, GOCEMS AI and compliance. Together they cover the path from a connected analyzer to a signed performance pack, and an on-demand report that explains a period, not just the live reading.
How does a reading get from the stack to the EPA?
Analyzers sample at the duct. A local logger buffers the series so a dropped link does not erase an hour. Encrypted ingest tags the reading to the facility and stack. Validation, averaging and normalisation run before anything reaches a dashboard or a report.
What if an analyzer goes offline or calibration is overdue?
Device health, calibration state and data availability travel with every reading. A gap is visible. It is never stored as a quiet zero.
What is GOCEMS AI?
GOCEMS AI sits beside live monitoring. When a team needs to understand a period, they choose a device, a date range and the pollutants that matter. GOCEMS then writes a report: a short summary, charts or health scores, insights ranked by severity, and recommended actions.
Bring your own stacks, limits and reporting calendar.
A walkthrough maps your site onto GOCEMS: instruments, averaging periods, who gets the alert, and what the signed report looks like.